Berichterstattung & KPI`S
Machen Sie das Beste aus den vom System gesammelten Daten mit Anpassungsberichten und Key Performance Indikatoren.
Die Datenerfassung ist der erste Schritt zur Transparenz, der zweite und noch entscheidendere Schritt ist die Analyse der gesammelten Daten, damit sie Ihnen helfen können, bessere Entscheidungen zu treffen, wenn Sie nach Möglichkeiten zur Verbesserung Ihres Unternehmens suchen.
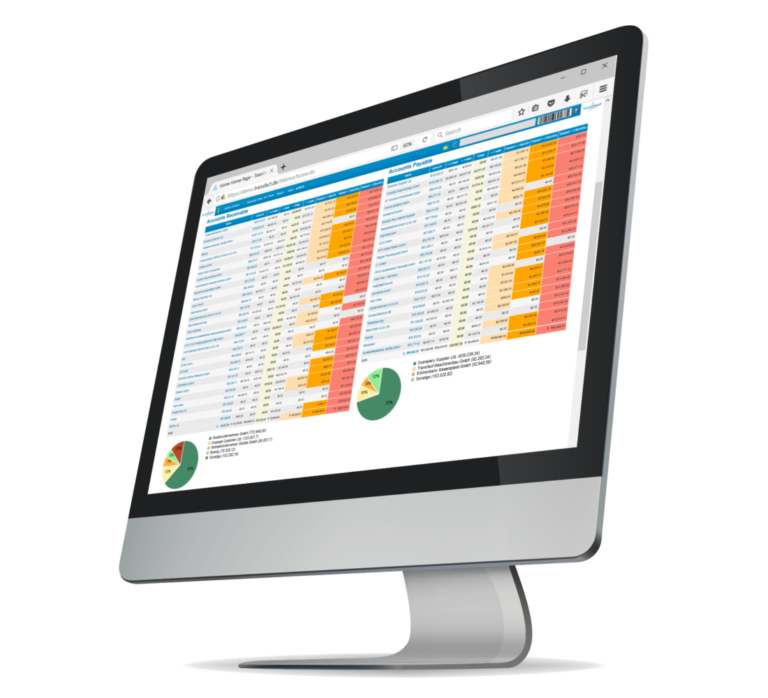
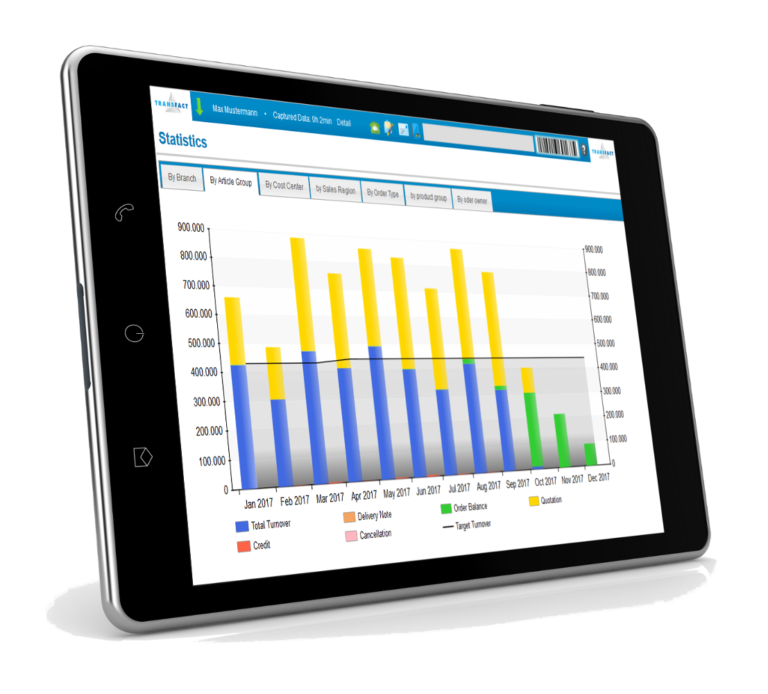
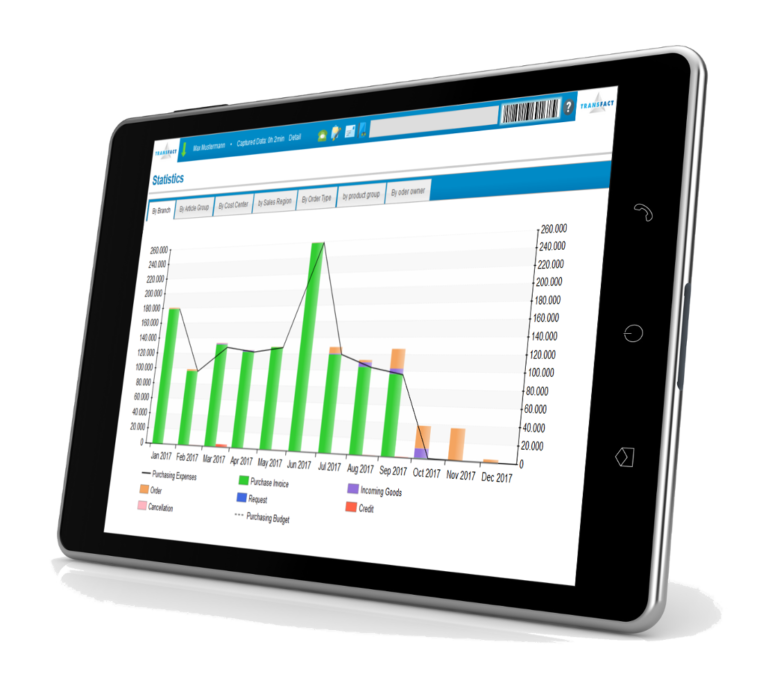
Die KPI-Berichte von Transfact bieten Ihnen mehrere Grafiken und Tabellen in verschiedenen Bereichen, die Ihnen einige der gebräuchlichsten und relevantesten Key Performance Indicators in jedem Bereich zeigen, die die Daten im System in übersichtlichen und nützlichen Übersichten zusammenfassen.


Maschinenleistung
Verschaffen Sie sich einen Überblick über Ausfallzeiten, Produktivität, Verteilung von Rüst- und Ausführungszeiten, Leerlaufzeiten und Zeiten für Nacharbeitsprozesse.
Zeigen Sie die Ergebnisse täglich, wöchentlich, monatlich oder jährlich an, je nachdem, welchen Detaillierungsgrad Sie für die Analyse benötigen.
Erhalten Sie Durchschnittswerte und Summen für jede Maschine oder für ganze Produktionsbereiche unter Berücksichtigung aller darin verwendeten Maschinen.

Produktionszeit
Erhalten Sie einen genauen Vergleich der tatsächlichen mit den geplanten Produktionszeiten in Echtzeit.
Analysieren Sie den Vergleich für Ihre gesamte Produktionsanlage, für jeden Produktionsbereich oder sogar für jede Maschine und verschaffen Sie sich einen Überblick entweder nach Jahr, nach Monat oder nach Woche.
Nutzen Sie dieses Modul für beides: die Verbesserung der für die Planung und Terminierung verwendeten Produktionszeiten sowie die Identifizierung möglicher Produktivitätsprobleme.


Herstellkosten
Eine automatisch berechnete, organisierte und strukturierte Übersicht über Ihre Produktionskosten.
Speziell für die Auftragsfertigung konzipiert, erhalten sie eine umfassende und detaillierte Kalkulation der Kosten für jeden Produktionsauftrag.
Filtern und analysieren Sie Ihre Ergebnisse nach Artikel, Kunde, Datum oder Artikelgruppe und erhalten Sie alle Informationen über Produktionszeiten, Bedienerzeiten, Material- und Ressourcenverbrauch.

OTD: Termingerechte Lieferung
Im Transfact-System werden die Liefertermine sehr genau überwacht und verfolgt, es gibt zahlreiche Warnhinweise und Support-Tools, die Ihnen helfen, Ihre Termine einzuhalten.
Dieser Bericht bietet Ihnen eine grafische Zusammenfassung des gesamten Geldwertes der Aufträge, die verspätet abgeschlossen wurden.
Sie gibt auch die durchschnittliche Gesamtzahl der Tage an, an denen die Bestellungen verspätet waren.
Die Filter ermöglichen es Ihnen, den Bericht nach Woche, Monat oder Jahr zu visualisieren sowie nach bestimmten Artikeln, Artikelgruppen, Kunden oder einem bestimmten Zeitraum aufzuschlüsseln.


Artikel-Cockpit
Das Transfact Artikel-Cockpit bietet einen sehr umfassenden Überblick über alle Ihre im System verfügbaren Artikeldaten.
Die Übersicht kann so konfiguriert werden, dass sie genau die Artikeldaten anzeigt, die jeder Benutzer benötigt, und sie verfügt über integrierte Filter, die das Auffinden der gesuchten Daten erleichtern.
Zeigen, überprüfen und exportieren Sie Ihre Daten in einer organisierten und anpassbaren Struktur.
Verwenden Sie die Funktion des Artikel-Cockpits, um die Richtigkeit Ihrer Artikeldaten zu überprüfen.

Allgemeine Lieferantenbewertung
Die Lieferantenbewertung berechnet automatisch eine A-, B- oder C-Note für Lieferanten auf der Grundlage ihrer Lieferzeit-, Qualitäts- und Quantitätstreue.
Die Auswertung berücksichtigt alle Lieferungen der letzten 3 Jahre für die Durchschnittsnote, um die Zuverlässigkeit der vergebenen Noten zu erhöhen.
Auch hier bietet das System die Möglichkeit, die einzelnen Bestellungen und Lieferungen, aus denen sich die allgemeine Auswertung zusammensetzt, im Detail aufzuschlüsseln und zu analysieren.


